Home > Provider User Manual > 11 Child Reports > 11.2 Graphed Scores
11.2 Graphed Scores
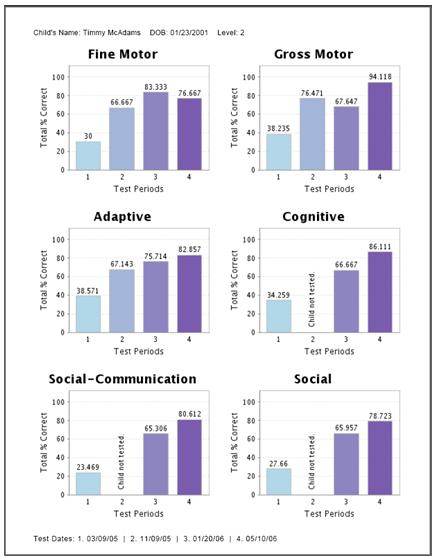
The Graphed Scores Reports allows you to compare data for different test periods. By comparing test periods as side-by-side bar graphs, you have a quick visible representation of a child's progress over time.
To view Graphed Scores, click the View/Print link. You will be directed to a page that shows the available test periods for the child. You may select up to four test periods to include in the Graphed Scores report.
Next, select the type of graphed score report you would like to create. The following options are available:
- % of Mastered and Emerging (2 and 1): This report will add all items that were scored 1's and 2's and display as a percentage of the total score possible for each area.
- % of Mastered (2): This report will add all items that were scored 2's and display as a percentage of the total score possible for each area.
- % of Emerging (1): This report will add all items that were scored 1's and display as a percentage of the total score possible for each area.
- % of Scoring Note A: This report shows the percentage of items that had an accompanying scoring note of A for each area.
- % of Scoring Note B: This report shows the percentage of items that had an accompanying scoring note of B for each area.
- % of Scoring Note M: This report shows the percentage of items that had an accompanying scoring note of M for each area.
- % of Scoring Note Q: This report shows the percentage of items that had an accompanying scoring note of Q for each area.
- % of Scoring Note R: This report shows the percentage of items that had an accompanying scoring note of R for each area.
Once you have selected your reporting option, select the Create Report button. The Graphed Scores report will appear in a new browser window in a PDF format.
Previous | Next
See also

| 


 Page URL: