Home > Provider User Manual > 14 My Reports > 14.3 About OSEP Reporting
14.3 About OSEP Reporting
OSEP reporting is easy with AEPSinteractive. The AEPS Test results are automatically transformed into an OSEP report using the crosswalk of AEPS Test items with the three OSEP Child Outcomes and empirically derived same-age peer benchmarks.
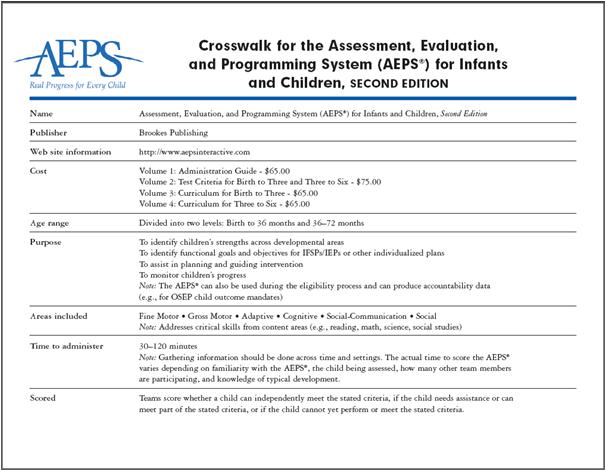
AEPS's crosswalk of test items correlated to OSEP child outcomes has been empirically validated, so users can rest assured that child outcomes data reported with AEPS and AEPSi are accurate and genuine measures of OSEP Child Outcomes. With reliable child outcomes data, you can better tailor interventions to the child's needs and be confident that your entry and exit data will show progress. To generate the OSEP Report, AEPSi:
- Calculates each child’s OSEP Outcomes raw scores by gathering and summing children’s scores on the specific AEPS Test items that correlate to the three child outcomes required by OSEP. If the COSF form was used in place of an AEPS assessment, the system converts the ECO ratings to the equivalent AEPS OSEP raw score.
- Calculates for each child whether or not he/she is performing at the level of same-age peers. Outcome raw scores are compared to empirically validated same-age peer benchmarks at the appropriate age intervals. Raw scores at or above the benchmarks indicate that a child’s performance is similar to same-age peers. Raw scores below the benchmarks indicate that a child’s performance is below that of same-age peers.
- Sorts children into two "baskets" at time 1 (Near-Entry into the program):
- Performing as same-age peers
- Not performing as same-age peers
- Sorts children into five "baskets" at time 2 (Near-Exit from the program):
- Maintained functioning at a level comparable to same-age peers
- Improved functioning to reach a level comparable to same-age peers
- Improved functioning to a level nearer to same-aged peers but did not reach comparable level
- Improved functioning but not sufficient to move nearer to functioning comparable to same-aged peers
- Did not improve functioning
There are six OSEP reports that are available in a viewable, printable, and exportable format. The reports are automatically separated by Part B and Part C.
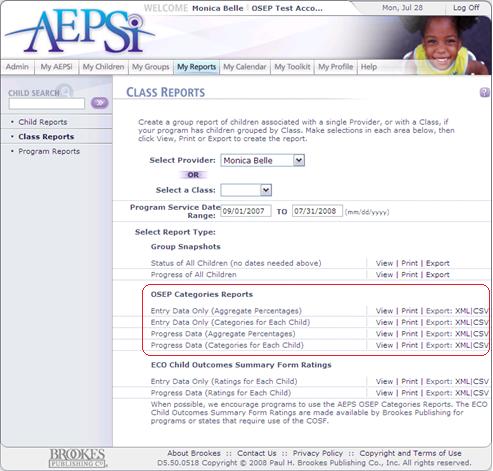
OSEP Categories Reports
- Entry Data Only (Aggregate Percentages)
- Entry Data Only (Categories for Each Child)
- Progress Data (Aggregate Percentages)
- Progress Data (Categories for Each Child)
ECO Child Outcomes Summary Form Ratings
- Entry Data Only (Ratings for Each Child)
- Progress Data (Ratings for Each Child)
All of the OSEP Categories reports can be run from the Class Reports page by selecting a service date range and then clicking on the View link next to the report you would like to run.
All OSEP Categories reports can also be printed from these pages or exported into XML or CSV files.
14.3.1 Children on the Alternative Path
Children who are 37 months or older and are still using the Level I test due to severe developmental disabilities are automatically placed on the alternative path for OSEP Reporting. At Near-Entry, these children will automatically have an OSEP outcome of not performing as same-age peers. Based on an alternative method, AEPSi will generate OSEP outcomes and recommended ECO ratings. On the Raw Score reports, the raw score and same-age benchmark will be displayed as "n/a".

There is nothing a user needs to do in order to place a child on the Alternative Path. If the child is 37 months or older and a Level I test was used to assess the child, that child will automatically be placed on the alternative path.
14.3.2 Entry Data Only (Aggregate Percentages)
The Entry Data Only (Aggregate Percentages) report calculates each child's OSEP Outcomes raw scores, compares them to same-age peer benchmarks, and aggregates the results for each of the three OSEP Child Outcomes.
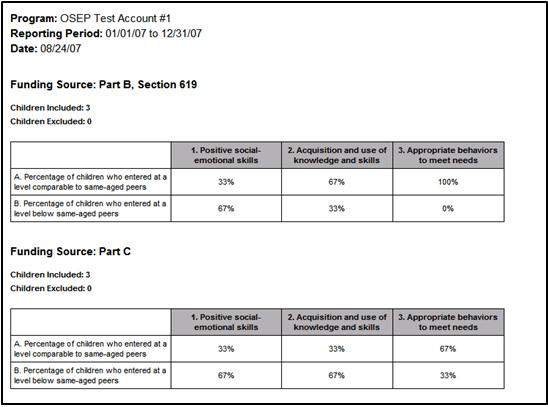
The report displays the percentage of children who are performing at a level comparable to same-age peers and the percentage of children who are not performing at a level comparable to same-age peers.
The results are separated by Part B and Part C, according to the funding source that was selected in the child profile.
The report also displays the number of children who were included in the report and the number of children who were excluded. For more details on children who were excluded from the report, run the Entry Data Only (Categories for Each Child) (Section 14.3.4).
To create an Entry Data Only (Aggregate Percentages) report for a specific class or provider:
- Select the Class Report link from the My Reports section.
- Select either the provider or the class from the dropdown menu.
- Specify a date range. When selecting the Entry Data Only (Aggregate Percentages) report, the system will pull all data where the Program Entry Date from the child profile is within that range.
- Select either the View, Print, or Export link next to the Entry Data Only (Aggregate Percentages). The Print link will open the report in a PDF format. You have the option to print or save the report to your computer.
14.3.3 Progress Data (Aggregate Percentages)
The Progress Data (Aggregate Percentages) report is used for when a child exits the program. The report calculates each child's OSEP Outcomes raw scores, compares them to their Near-Entry raw scores and/or same-age peer benchmarks, and aggregates the results for each of the three OSEP Child Outcomes.
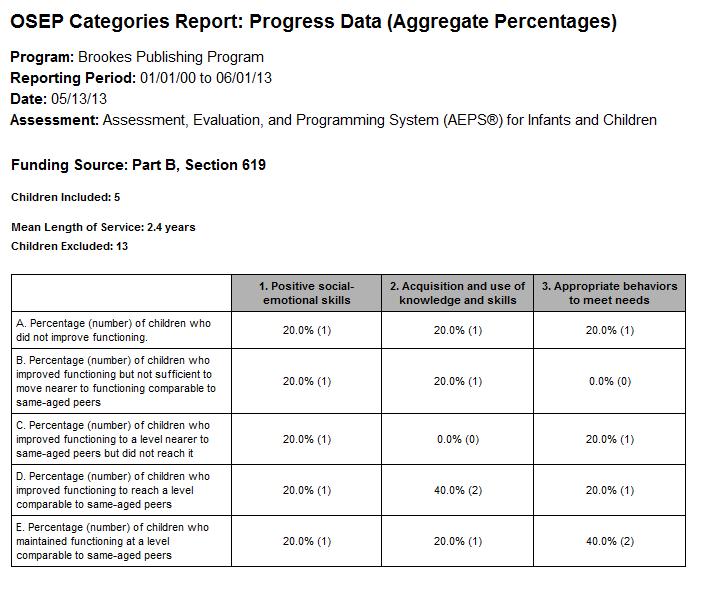
The report displays the percentage and number of children who at Near-Exit, maintained functioning at a level comparable to same-age peers, who improved functioning to reach a level comparable to same-age peers, improved functioning to a level nearer to same-age peers but did not reach a comparable level, improved functioning but not sufficient to move nearer to functioning comparable to same-age peers, and did not improve functioning.
This report also gives the mean length of service for children in the program, measured in years.
The results are separated by Part B and Part C, according to the funding source that was selected in the child profile.
The report also displays the number of children who were included in the report and the number of children who were excluded. For more details on children who were excluded from the report, run the Progress Data (Categories for Each Child) (Section 14.3.5).
To create an Progress Data (Aggregate Percentages) for a specific class or provider:
- Select the Class Report link from the My Reports section.
- Select either the provider or the class from the dropdown menu.
- Specify a date range. When selecting the Progress Data (Aggregate Percentages) report, the system will pull all data where the Program Exit Date from the child profile is within that range.
- Select either the View, Print, or Export link next to the Progress Data (Aggregate Percentages). The Print link will open the report in a PDF format. You have the option to print or save the report to your computer.
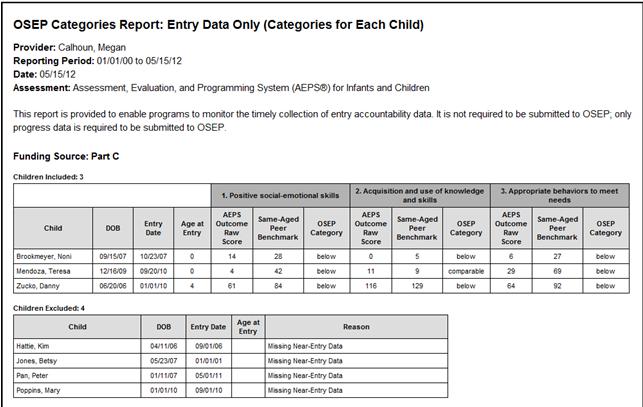
The Entry Data Only (Categories for Each Child) calculates and displays each child's OSEP outcome raw scores for each of the three OSEP Child Outcomes, the corresponding same-age peer benchmarks, identifies the OSEP category as "comparable" or "below".
In addition, the report displays the child's name, date of birth, program entry date, and age at entry.
The report is separated by Part B and Part C. In addition, the export versions of the report (XML and CSV) include any custom fields that have been created.
A list of children who were excluded from the report and the reason why is also included. See Section 14.3.8 for more information on exclusion categories.
To create an Entry Data Only (Categories for Each Child) for a specific class or provider:
- Select the Class Report link from the My Reports section.
- Select either the provider or the class from the dropdown menu.
- Specify a date range. When selecting the Entry Data Only (Categories for Each Child) report, the system will pull all data where the Program Entry Date from the child profile is within that range.
- Select either the View, Print, or Export link next to the Entry Data Only (Categories for Each Child). The Print link, will open the report in a PDF format. You have the option to print or save the report to your computer.
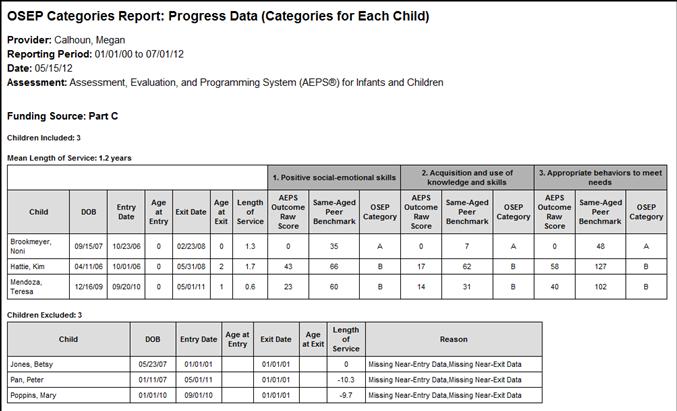
The Progress Data (Categories for Each Child) calculates and displays each child's OSEP outcome raw scores for each of the three OSEP Child Outcomes, the corresponding same-age peer benchmarks, and the OSEP category.
In addition, the report displays the child's name, date of birth, program entry date, age at entry, age at exit, length of service (measured in years), and program exit date. The report is separated by 'Part B' and 'Part C'. In addition, the export versions of the report (XML and CSV) include any custom fields that have been created.
A list of children who were excluded from the report and the reason why is also included. See Section 14.3.8 for more information on exclusion categories.
To create a Progress Data (Categories for Each Child) report for a specific class or provider:
- Select the Class Report link from the My Reports section.
- Select either the provider or the class from the dropdown menu.
- Specify a date range. When selecting the Progress Data (Categories for Each Child) report, the system will pull all data where the Program Exit Date from the child profile is within that range.
- Select either the View, Print, or Export link next to the Progress Data (Categories for Each Child). The Print link will open the report in a PDF format. You have the option to print or save the report to your computer.
14.3.6 ECO Child Outcomes Summary Form Ratings: Entry Data Only (Ratings for Each Child)
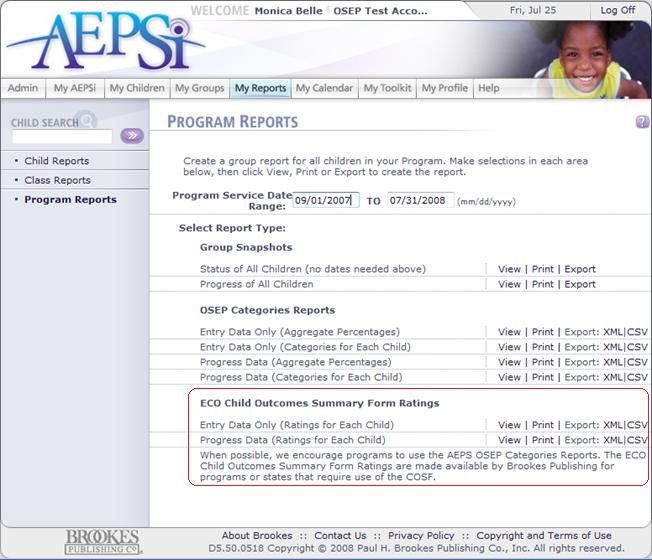
There are two ECO Child Outcomes Summary Form Ratings, one with Near- Entry data only and one with progress data.
These reports can be run from the Class Reports page by selecting the service date range and then clicking on the View link next to the report you would like to run.
The ECO Child Outcomes Summary Form Ratings can also be printed from these pages or exported into either XML or CSV files.
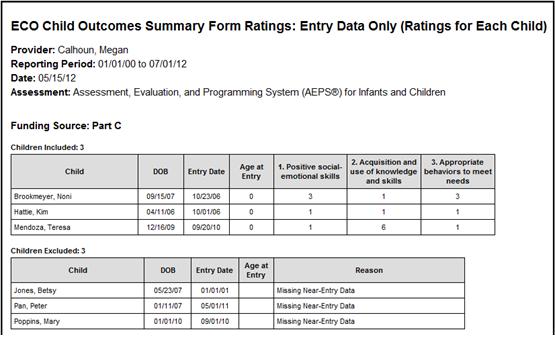
AEPSi provides a recommended ECO Rating for each child using the 1 to 7 scale.
The report displays the child's name, date of birth, program entry date, age at entry (measured in years), and the recommended ECO rating for each of the three outcomes.
If the COSF form was used for Near-Entry data, the report will display the ECO ratings that were entered into the form.
In addition, the export versions of the report (XML and CSV) include any custom fields that have been created.
The report also includes a list of children who were excluded from the report and the reason why. See Section 14.3.8 for more information on the exclusion categories.
To create an Entry Data Only (Ratings for Each Child) for a specific class or provider:
- Select the Class Report link from the My Reports section.
- Select either the provider or the class from the dropdown menu.
- Specify a date range. When selecting the Entry Data Only (Ratings for Each Child) report, the system will pull all data where the Program Entry Date from the child profile is within that range.
- Select either the View, Print, or Export link next to the Entry Data Only (Ratings for Each Child). The Print link will open the report in a PDF format. You have the option to print or save the report to your computer.
14.3.7 ECO Child Outcomes Summary Form Ratings: Progress Data (Ratings for Each Child)
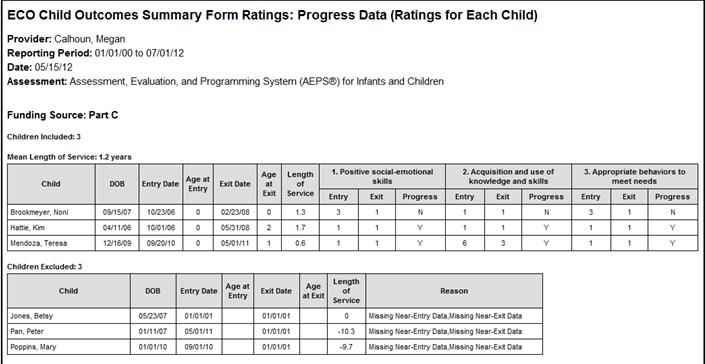 The Progress Data (Ratings for Each Child) displays the recommended ECO ratings for Near-Entry, Near-Exit, and indicates whether progress occurred (Y for yes, N for no).
Also included in the report is the child's name, date of birth, program entry date, age at entry, program exit date, age at exit, and length of service (measured in years).
In addition, the export versions of the report (XML and CSV) include any custom fields that have been created.
A list of children who were excluded from the report and the reason why is displayed as well. See Section 14.3.8 for more information on the exclusion categories.
To create a Progress Data (Ratings for Each Child) for a specific class or provider:
- Select the Class Report link from the My Reports section.
- Select either the provider or the class from the dropdown menu.
- Specify a date range. When selecting the Progress Data (Ratings for Each Child) report, the system will pull all data where the Program Exit Date from the child profile is within that range.
- Select either the View, Print, or Export link next to the Progress Data (Ratings for Each Child). The Print link will open the report in a PDF format. You have the option to print or save the report to your computer.
A child may be excluded from an OSEP report due to several reasons. Below, are a list of the exclusion categories and what you need to do to correct the error.
- Missing Near-Entry Data: Either the Near-Entry assessment has not been selected for a child or it has not been finalized.
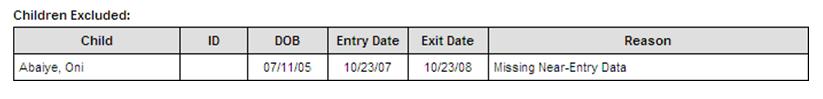
What you should do: Make sure you have selected a Near-Entry assessment for the child. On the child's Summary page, you should see an "OSEP entry" icon next to the assessment you want flagged for Near-Entry. If you do not see the icon, go to the CODRF Summary page of the assessment , and select "Near-Entry" under the "OSEP Include" option. Also, verify that the assessment has been finalized and that all test items are complete. If another assessment tool was used to assess a child at Near-Entry, the online COSF (Child Outcomes Summary Form) can be used in place of an AEPS assessment.
- Missing Near-Exit Data: Either the Near-Exit assessment has not been selected for a child or it has not been finalized.
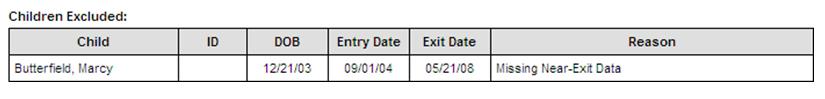
What you should do: Make sure you have selected a Near-Exit assessment for the child. On the child's Summary page, you should see an "OSEP exit" icon next to the assessment you want flagged for Near-Exit. If you do not see the icon, go to the CODRF Summary page of the assessment , and select "Near-Exit" under the "OSEP Include" option. Also, verify that the assessment has been finalized and that all test items are complete.
- Less than 6 months in services: There are less than six months between the child's Program Entry and Program Exit date. This is mandated by federal law.
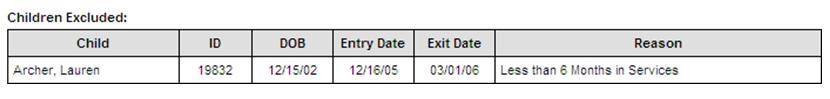
What you should do: Go to the child's Profile page and verify that you have entered the correct Program Entry and Program exit dates. If you have entered the correct dates and there are still less than six months of services received, this child will have to be excluded from OSEP reporting.
- Invalid Funding Source: A funding source other than Part B or Part C has been selected for the child.
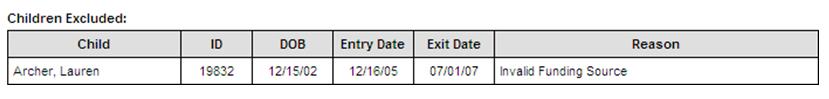
What you should do: Go to the child's Profile page and verify that either Part B, or Part C has been selected for funding source.
- Inappropriate age at Level II test: If a child is 36 months or younger and is using a Level II test, the inappropriate test was used to assess the child. A level II test should be used only once a child is older than 36 months.
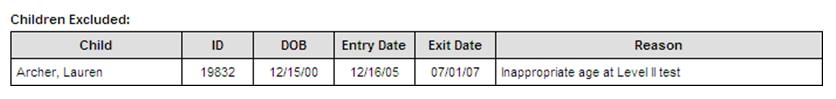
What you should do: Assess the child with the age-appropriate test.
14.3.9 Exporting OSEP Reports
The OSEP Reports and ECO Child Outcomes Summary Form Ratings are exportable in two formats: XML (Extensible Markup Language) and CSV (Comma Separated Value). If you need to export the reports to be able to import into another data system, you should export using XML. If you want to export your reports into Excel, CSV is the best option.
To export a report:
- Select the Class Report link from the My Reports section.
- Select either the provider or the class from the dropdown menu.
- Specify a date range. When selecting the Progress Data (Ratings for Each Child) report, the system will pull all data where the Program Exit Date from the child profile is within that range.
- Select either the XML or CSV link next to Export. A dialogue window will appear where you can either open the file or save it to your computer.
Note: The export version of the OSEP Categories Reports and the ECO Child Outcomes Summary Form Ratings reports include any custom fields that have been created for the child profile.
Previous | Next
See also

14.1 Child Reports
14.2 Provider/Class Reports
|


 Page URL: